Title anotation

A blog by Leigh Perrott for MN0477 Financial Risk Management.

Saturday, 18 April 2015

Performance and Adjustments (Week 8)

This post will take a quick look at the performance of the client's portfolio from week 4 to week 8 in order to see how effective the mean-variance optimization approach has proven. Also the structural effects of the changes made in week 8 will be summarized (see the previous post about forecasting interest rate changes for the rationale behind these new changes).

Graphed below is the portfolio performance against the benchmark over the past 4 weeks: 


Again, we are seeing highly comparable performance to that of the benchmark. A positive note to mark however is that instead of slight under-performance as in the first 4 weeks, there is now slight over-performance in this period. The return of the clients portfolio was 2.44%, compared to the 2.15% return of the benchmark index.

Overall, this seems like a good sign that the optimization of the portfolio has led to more fine-tuning of performance relative to the benchmark. It will be interesting to see once data up to 12 weeks is collected, how the performance is attributed by Bloomberg.

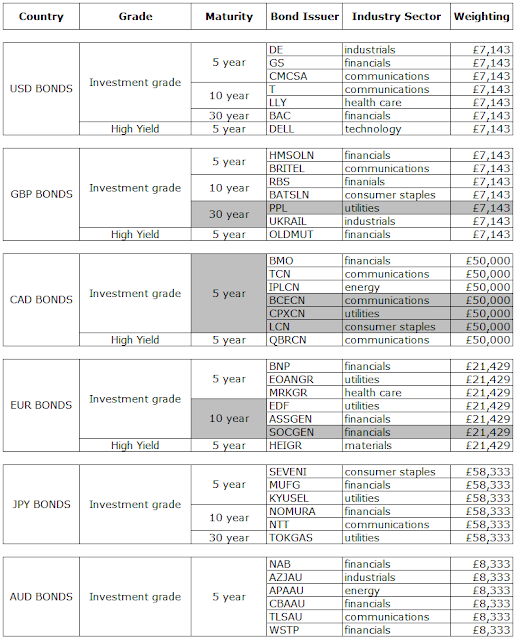
In the mean-time, here are the most recent changes made in week 8:

(Structural changes have been shaded in grey)
Overall, the average maturity of bonds in the portfolio has decreased. This is no surprise, as the active changes have been made in order to target changes in duration.

Looking at characteristics on a country level shows that modified duration of the Canadian segment has been dramatically decreased (now 5.05 from 9.86), the Euro segment has been decreased moderately (now 6.97 from 9.34) and the UK segment has been increased moderately (now 11.60 from 8.64).


--

Saturday, 4 April 2015

Forecasting Interest Rate Changes

The goal of active portfolio management is to achieve excess returns. In order to achieve this we need to 'beat the market' by figuring out how certain bonds are under or over-priced given the current conditions.

No doubt the single greatest influence on corporate bonds is the effect of the term structure of interest rates. The term structure (i.e. the yield curve) indicates the rate at which the various cash flows associated with a bond should be discounted at, and thus determine its theoretical present value. Over terms at which the yield curve is higher, it suggests greater discounting and therefore lower contribution to present value. Thus forecasting changes to the yield curve will not only imply whether we should aim to increase or decrease modified duration within the portfolio, but also indicate exactly how this should be done, i.e. what structural changes should be made at each maturity.

Here is the current yield curve for Canadian Sovereign debt:


Suppose we forecast rates to increase across the entire term structure - what changes should we make the the selection of bonds by maturity?


Well, since bond prices will decrease as yields increase, we should aim to reduce exposure to rising interest rates by as much as possible. In terms of choosing between 5y, 10y, and 30y bonds - all higher maturity bonds should be discarded in favor of shorter 5y bonds. 


Below is the Eurozone yield curve:


Suppose this time we forecast a change in the way yields curve over maturities - what are the most appropriate adjustments to be made in response to this prediction?


Well, applying similar logic as above, we should invest more in 10y bonds (for which we expect prices to go up) and less in 30y bonds (for which we expect prices to go down). Note that there are also expected gains for 5y bonds, but not to the same extent as for 10y bonds according to this forecast.

Let's finally consider the UK yield curve for sovereign issues of debt:


Our forecast now is that yields will become lower in the future and that this will be more pronounced for over greater maturities.


This last forecast implies we should seek to increase allocations in 30y bonds (we expect prices to rise) and that we are most indifferent to shifting allocations away from 5y bonds.

Below is a summary for the changes suggested based on each of these forecasts. In total 6 bonds have been removed from the portfolio to be replaced by 6 newly selected bonds. If the forecasts made above turn out to be accurate then we can expect that these adjustments will improve the expected return on our portfolio over the last 4 weeks.


--